Following the passage of the $1.2 trillion Bipartisan Infrastructure Law (BIL), America’s cities, towns and villages are eager to improve their local infrastructure. Last fall, NLC research highlighted how the workforce was unable and unwilling to meet the projected demand for infrastructure workers. The data used to support the findings in NLC’s Hard-to-Fill Infrastructure Jobs: A Challenge to Building Our Future was time-to-fill-job postings data from January to April 2021. Now a few months after the passage of BIL, we have a more current snapshot of the labor market’s ability and willingness to fill these critical infrastructure roles.
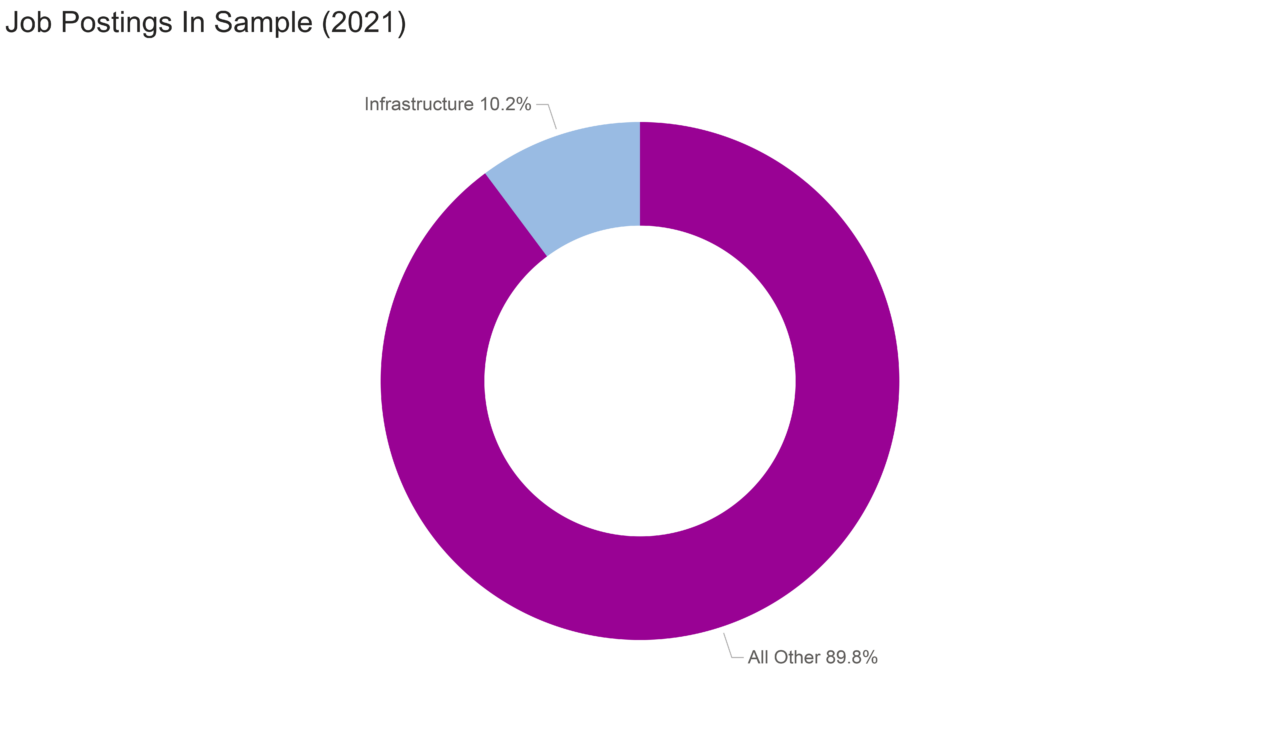
Throughout 2021, businesses in the U.S. posted roughly 23 million jobs. More than 2.3 million, just over 10 percent, of those jobs were infrastructure-related (figure 1). An infrastructure job is one in which the work required is related to the design, construction or maintenance of infrastructure. Using this definition, this analysis classifies all U.S. Bureau of Labor Statistics (BLS) occupations as either infrastructure or non-infrastructure and identifies 291 occupations as infrastructure-related that are sorted into 10 occupation groups (figure 2). Three-fourths of infrastructure job postings belong to the Transportation and Material Moving; Installation, Maintenance and Repair; Architecture and Engineering or Production job groups.

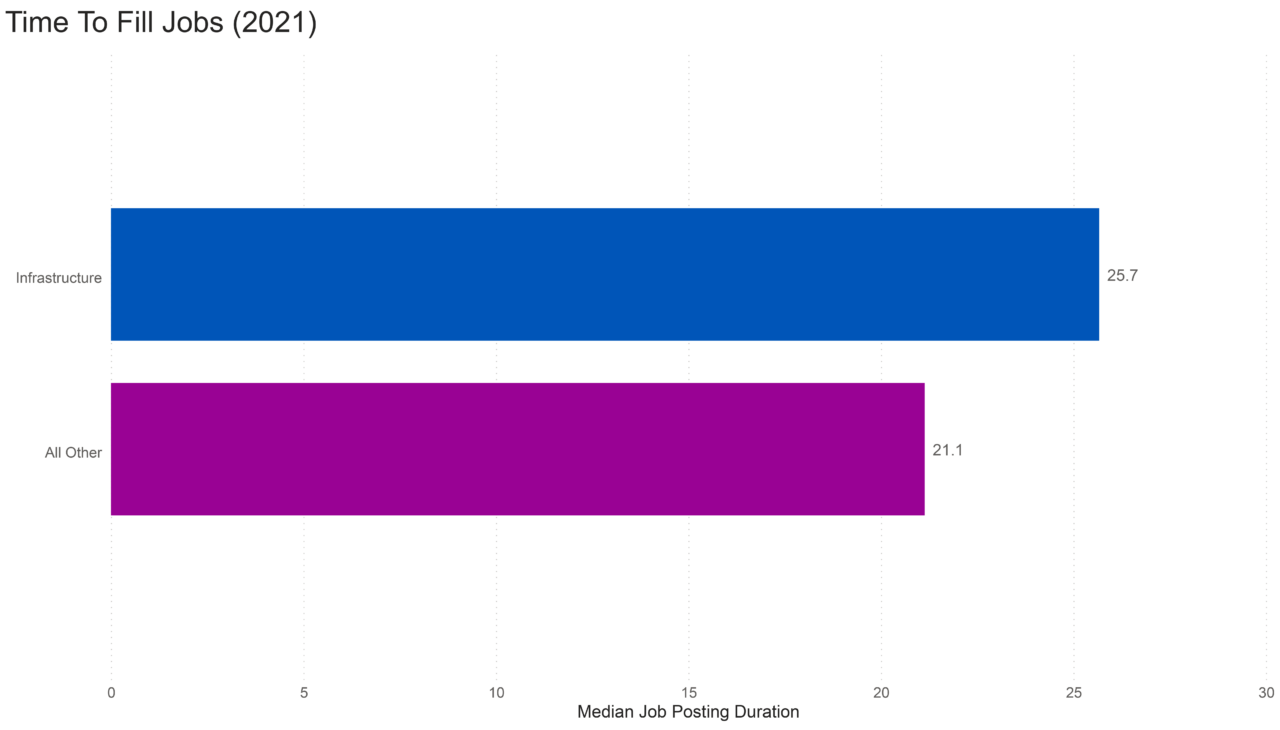
Since NLC’s initial research from September 2021, infrastructure jobs are now taking even more time to fill than all other jobs. From January to April 2021, infrastructure jobs took roughly 19 percent longer (23.5 days to fill) than all other jobs (which took an average of 19.5 days). However, throughout 2021, infrastructure jobs took nearly 22 percent more to fill than all other jobs (figure 3).
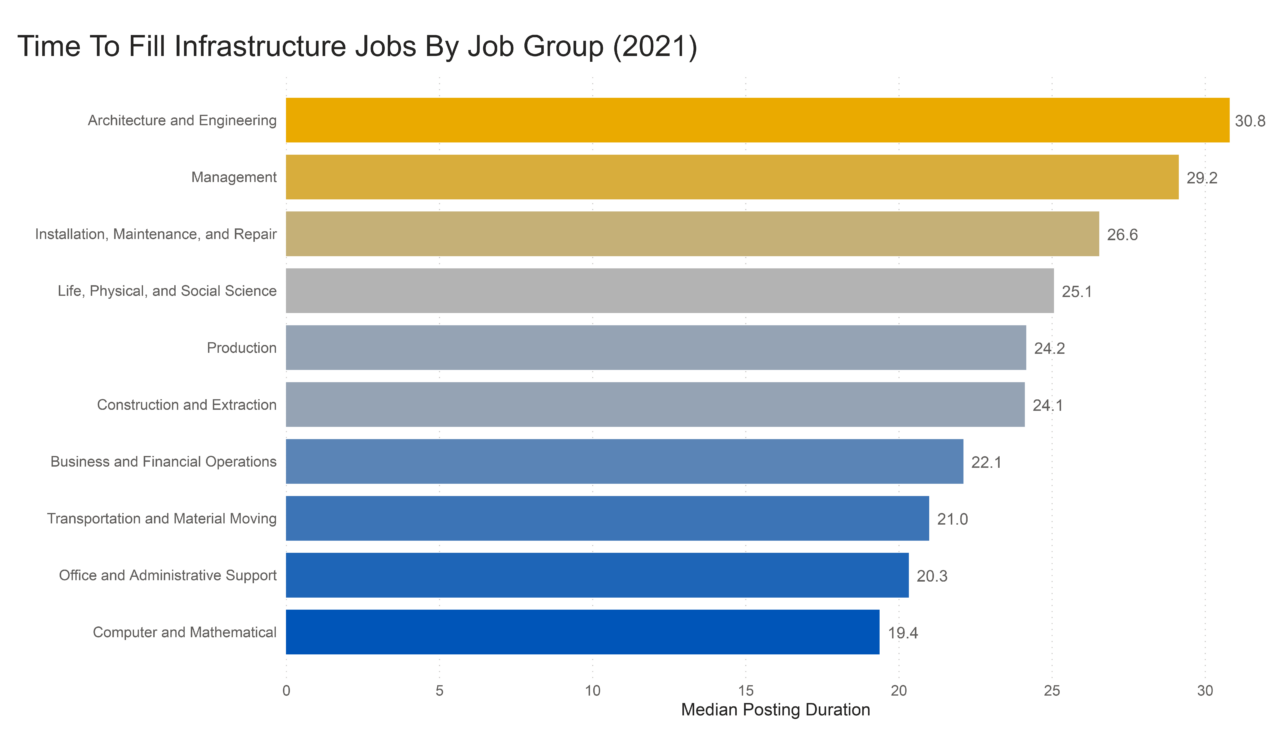
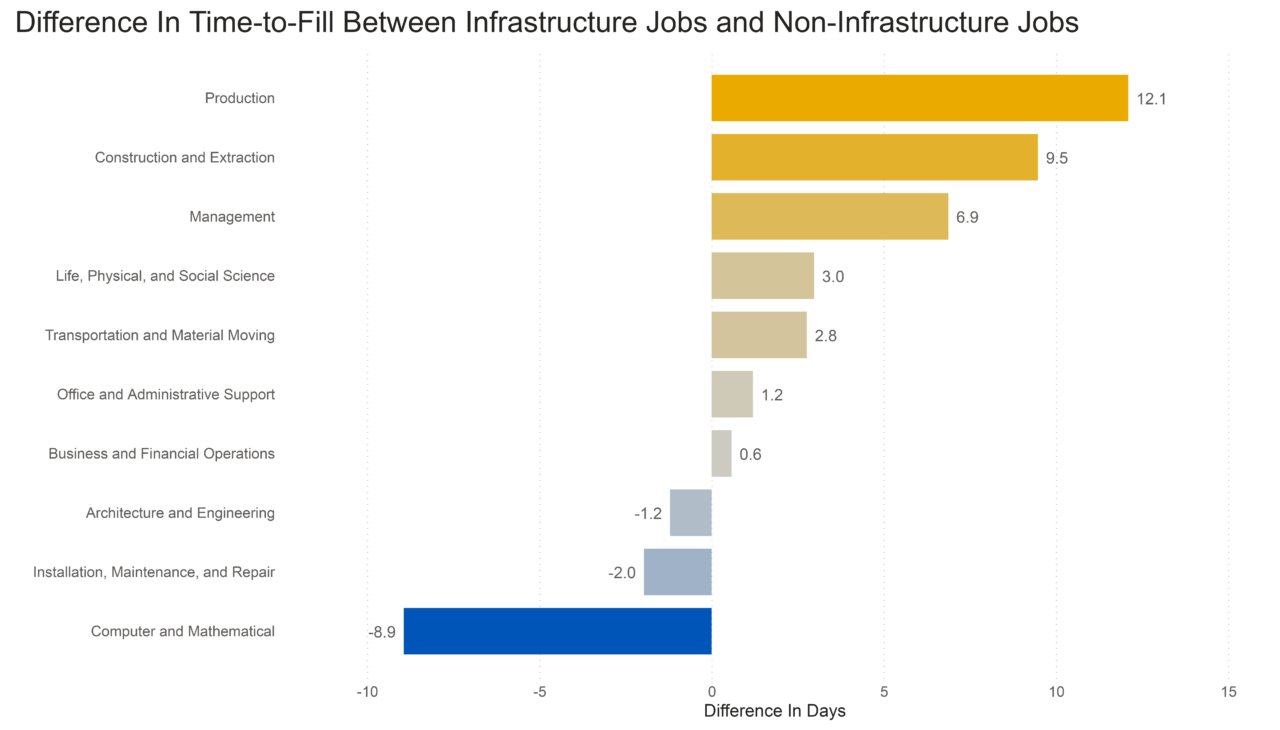
Infrastructure jobs that took on average the longest to fill in 2021 belonged to the Architecture and Engineering; Management; and Installation, Maintenance and Repair occupation groups (figure 4). Despite how long these roles take to fill, infrastructure job postings in Architecture and Engineering and Installation, Maintenance and Repair occupation groups take less time to fill than non-infrastructure jobs (see figure 5). Compared to non-infrastructure jobs in the same occupation group, Production; Construction and Extraction and Management infrastructure jobs are the hardest to fill.
NLC’s updated analysis demonstrates that during 2021, workers became less willing and able to take on infrastructure jobs as the year progressed, despite the historic availability of federal infrastructure funding. The BIL does not contain a proportional investment in skills training to ensure a pipeline of workers are ready to rebuild and expand our nation‘s crumbling infrastructure. Roadways and transportation projects will be delayed, bridges will not be repaired and broadband cannot be made more accessible without workers to fill these infrastructure jobs.
Workforce funding in the United States is incredibly low. Federal workforce funding as a proportion of GDP in the United States is the second-lowest among OEDC countries, at 0.1 percent. As a result, the federally-funded workforce system and the broader workforce community will struggle to mobilize an under-resourced system to meet employer demands for infrastructure jobs.
Congress continues to examine the issues of workforce investment. The Bipartisan Innovation Act, which has moved to conference to enable final passage, brings together two innovative competitiveness bills from the U.S. House of Representatives and the U.S. Senate to invest in solutions that will expand access to opportunity for all our residents and stimulate more equitable outcomes including investments in apprenticeship, Pell grant flexibility and competitive grant funding to support long-term economic development goals in cities, towns and villages.
NLC continues to advocate for at-scale investments in workforce development and supports a $40 billion investment as laid out in the House-passed Build Back Better Act, as well as the reauthorization of the Workforce Innovation and Opportunity Act, which was passed by the House in early May and now moves to the Senate for consideration.
Join us in asking Congress to invest in these key workforce provisions.


