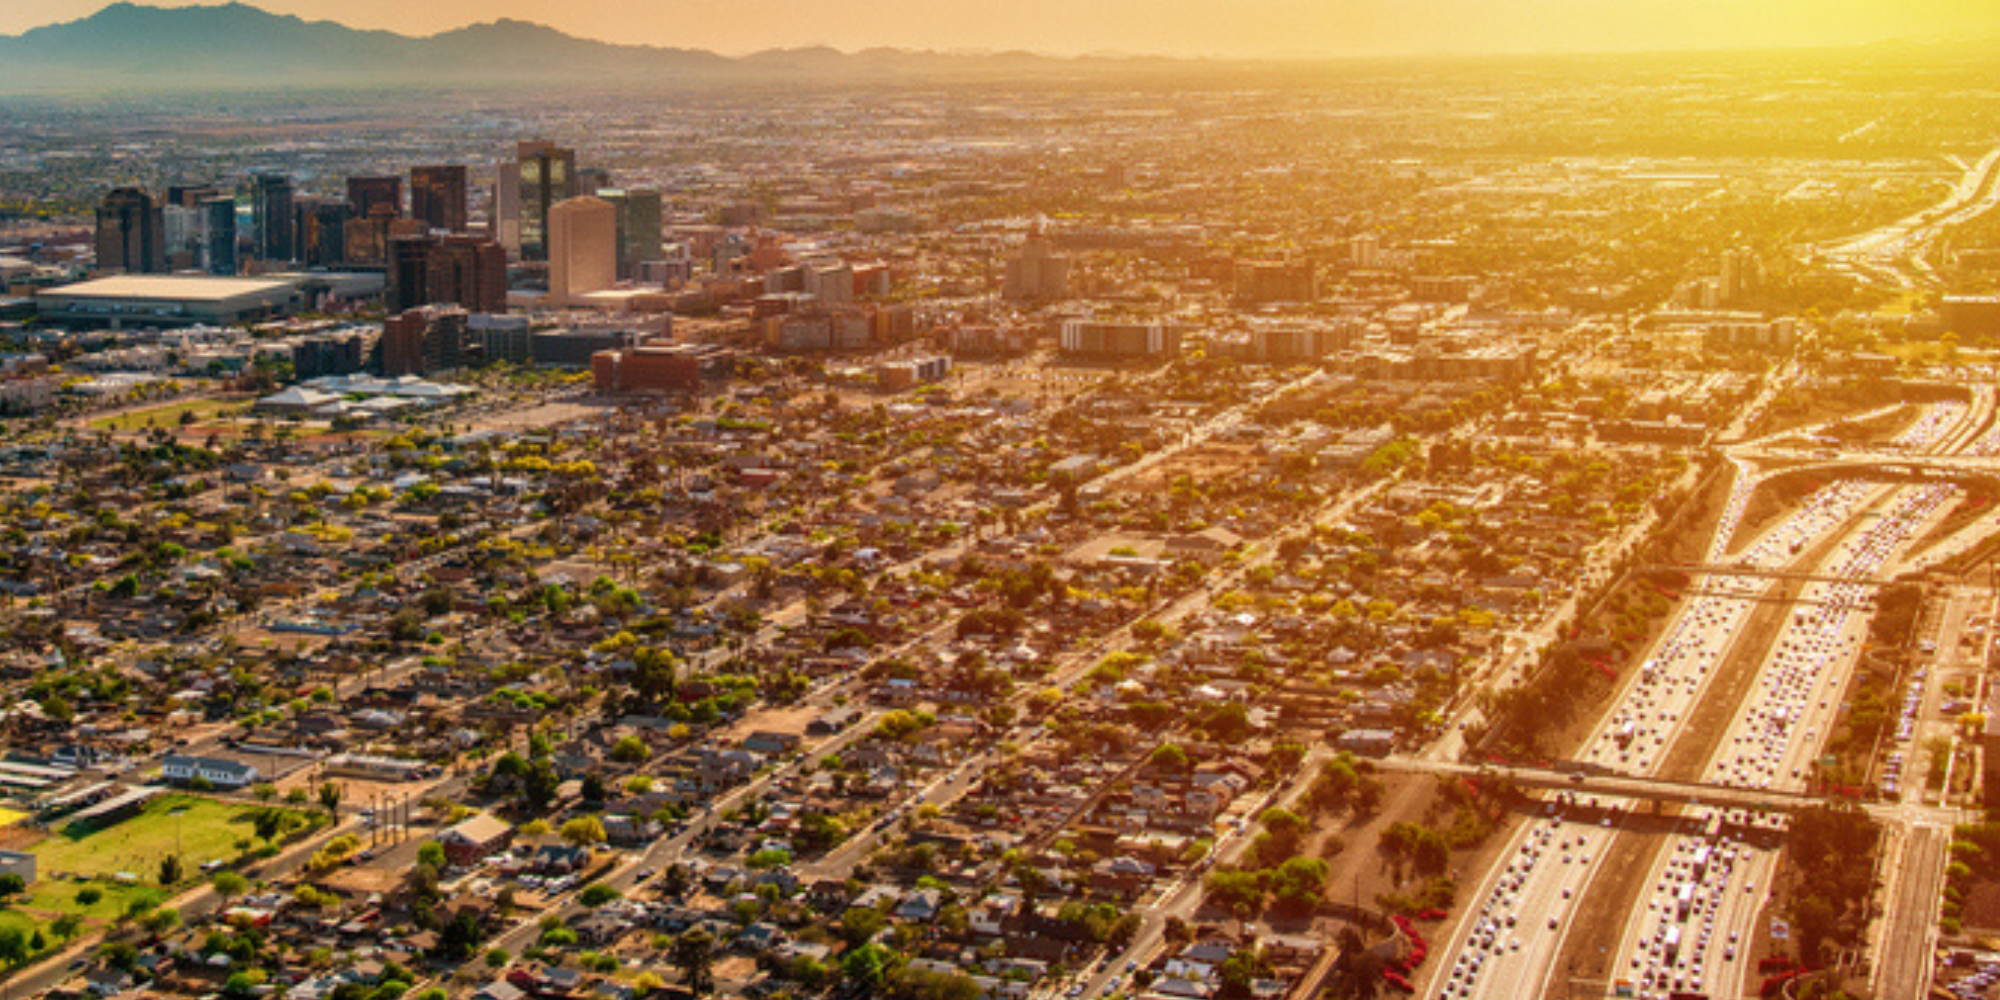
Many cities are experiencing the urban heat island effect, which has tremendous impacts on residents as climate changes increase the frequency and intensity of extreme heat events. According to the U.S. Environmental Protection Agency (EPA), Urban Heat Islands occur when municipalities replace green space with an urban environment such as pavement, buildings, and other surfaces that absorb and retain heat. Concentrated urban heat islands in cities can increase energy costs, air pollution levels, heat-related illness and even resident mortality. Climate change is only going to increase these effects as heat projections for the next several decades continue to rise. The warming from climate change compounded with urban heat islands is already having a severe impact across the country, as over the last 30 years (1992-2021), extreme heat caused more fatalities compared to other extreme weather events such as floods, tornadoes, cold and hurricanes.
Research from the National Oceanic and Atmospheric Administration (NOAA) has been mapping the urban heat island effect in more than 60 cities across the country and has found that poor communities tend to be hotter than wealthier neighborhoods. Often these low-income neighborhoods line up with historical redlining policies, thus disproportionately harming Black communities and communities of color. To alleviate these disparities, cities can look at heat equity, which is the development of policies and practices that can mitigate the urban heat island effect. Along with low-income neighborhoods, other groups like older adults, outdoor workers, and people who live alone or are homeless are also vulnerable to urban heat. Special attention should be given to groups with existing medical conditions such as asthma, which is more common in low-income and minority groups, because heat on sunny days can react with air pollutants to form smog, a major trigger of asthma.
Heat Resilience Solutions
To help with urban heat islands the EPA recommends communities invest in the following to mitigate the effects:
- Plant trees and increase vegetation
- Install green or cool roofs
- Replace normal pavement with cool pavement
- Think about adopting a smart growth
The EPA also has database of actions taken by communities to reduce heat islands. For example, the city of Saratoga Springs, NY’s urban forest project partners the city with a local non-profit to inventory city street and park trees. This inventory will then be used to develop an Urban Forest Master Plan. The city of Boston, MA has created a new forestry division within the Parks and Recreational Department as a part of the city’s Urban Forest Plan. The new division will work to maintain and increase the tree canopy throughout the municipality. Boston’s forestry initiative works in conjunction with their Heat Resiliency Solutions plan, a “framework to prepare Boston for hotter summers, with particular focus on Boston’s environmental justice neighborhoods.” Municipal leaders can also look to learning modules to assess and create solutions like the Heat Action Platform. Elected officials can also invest in transportation systems to reduce heat stress and impacts during heat events. Phoenix, AZ has been working to improve their bus shelters to cool passengers as they wait for buses by designing them to provide maximum shade. Route prioritization between vulnerable areas and cooling centers is something else that local leaders can consider. More resources are available at heat.gov and the Climate Mapping for Resiliency and Adaptation.
Several funding sources exist to combat excess urban heat. The Inflation Reduction Act (IRA) includes Neighborhood Access and Equity Grants, providing competitive grants for transportation infrastructure overhauls as well as explicit approval for urban heat mitigation projects; and Environmental and Climate Justice Grants, which also includes mitigating urban heat as an eligible activity. The IRA also allocates $1.5 billion to the U.S. Forest Service’s Urban and Community Forestry Program, which helps cities and towns plant trees through the State Urban Forest Resilience program and the National Urban Forestry Challenge Cost Share Program. Some federal agencies have ongoing grant programs in which funding can be used for many of the solutions used to combat urban heat. NOAA holds their annual Urban Heat Island Mapping campaign, which cities can apply for funding and technical assistance. Furthermore, your state is likely to have grants for tree planting – a simple google search will return relevant results for state and non-profit programs providing money to local governments. Lastly, NLC will be launching a new technical assistance program to support participating communities make resilient infrastructure the default in construction – stay tuned for more information and lessons learned.
Tool Explanation and Guidance
NLC has created the tool below to assist local governments in mitigating the urban heat island effect in their own community by visualizing which bus stops should be prioritized. We focus on bus stops and their corresponding heat wave risk to help address heat inequity, as vulnerable populations are more likely to take public transportation and live in areas with above national average heat wave risk. Along with heat wave risk, we also layer in tree canopy data, and you can see in the corresponding scatterplots the relationship between these two variables.
In the default “city view” page, each point represents city averages for tree canopy and heat risk, calculated by averaging all the individual bus stops within the city. You can toggle between the color scales for tree canopy cover or heat wave risk. On the city view scatterplot, the dotted line indicates cities’ national averages for both indicators, so you can see where your city’s bus stops are with respect to the average – useful data when applying for federal or state grants.
The “bus stop” view is best suited for exploring an individual city, which can be selected by the drop down menu in the upper left corner. In this view, each point on the map is an individual bus stop, which can also toggle between tree canopy cover and heat wave risk. On the bus stop view scatterplot, the dotted line indicates the national bus stop averages. By hovering over individual bus stops, you can view the corresponding census tract’s racial demographics and public transportation usage to further inform priority stops.
Lastly, you can also select for specific characteristics from the sliding scale bars in the top right corner, or by clicking and dragging over the scatterplot, which will filter the stops shown on the map. For example, you can filter for stops on the map that suffer from above average heat risk and/or below average vegetation cover to determine priority areas of investment.
Data Sources
- Tree Canopy – United States Forest Service
- Heat Wave Risk – FEMA
- Bus Stop – National Transit Database
The above dashboard was created using data from February 2023. For more information on tool methodology, email researchdatainquiries@nlc.org.


