As we approach the two-year anniversary of the passage of the American Rescue Plan Act (ARPA), new data from the Department of the Treasury has provided the fullest picture to date of how local, state, and tribal governments are investing the act’s $350 billion in State and Local Fiscal Recovery Funds (SLFRF)
Over the past nine months, Brookings Metro, the National League of Cities, and the National Association of Counties have been monitoring how 329 large cities and counties are utilizing a $65 billion share of SLFRF resources through the Local Government ARPA Investment Tracker. This post provides an update on these ARPA commitments and expenditures through September 30, 2022, including how recovery priorities are varying regionally.
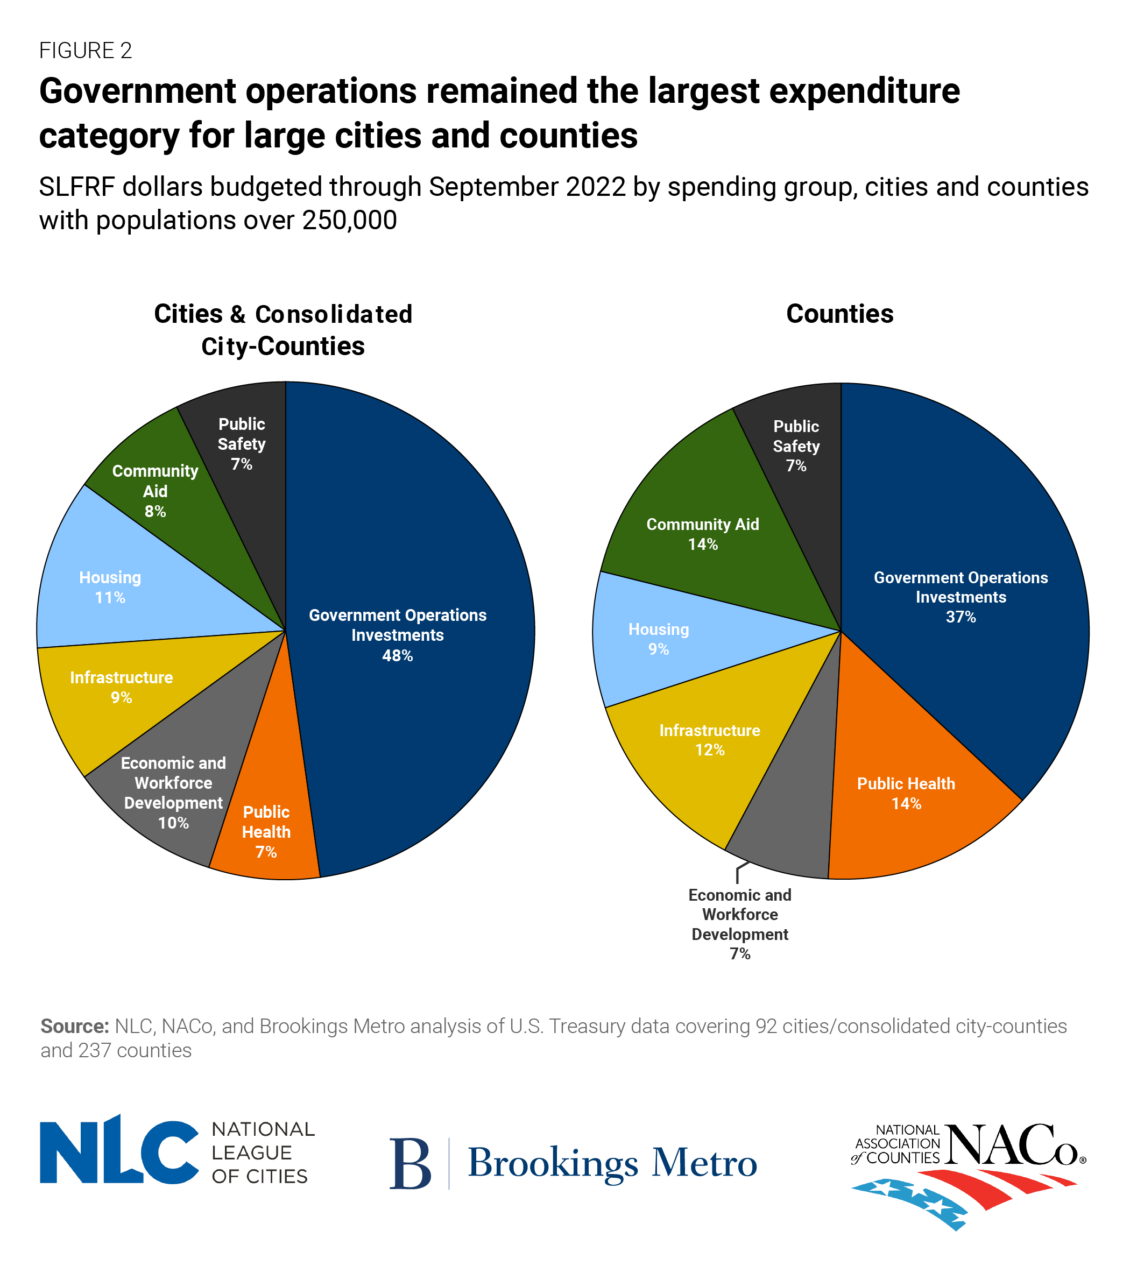
Large cities and counties have committed 68% of their SLFRF dollars
By September 2022, 329 large cities and counties had committed SLFRF dollars to 8,825 projects, compared to 7,537 projects at the end of June 2022 (a 17% increase).
The share of committed SLFRF dollars increased from 61% at the end of June to 68% at the end of September. Large cities/consolidated city-counties have budgeted a greater share of their allocations (79%) than large counties (59%). This faster pace may be due to large cities/consolidated city-counties’ decision to devote a greater share of their budgeted SLFRF dollars (57%) to revenue replacement as compared to large counties (37%).
In total, these local governments committed $44 billion in SLFRF allocations by the end of September—an increase of $5 billion since the end of the last reporting period. At this point, out of the 329 cities and counties, 63 had committed 100% of their SLFRF allocations: 34 counties and 29 large cities/consolidated city-counties.
The share of SLFRF allocations to different spending groups remained stable between June and September
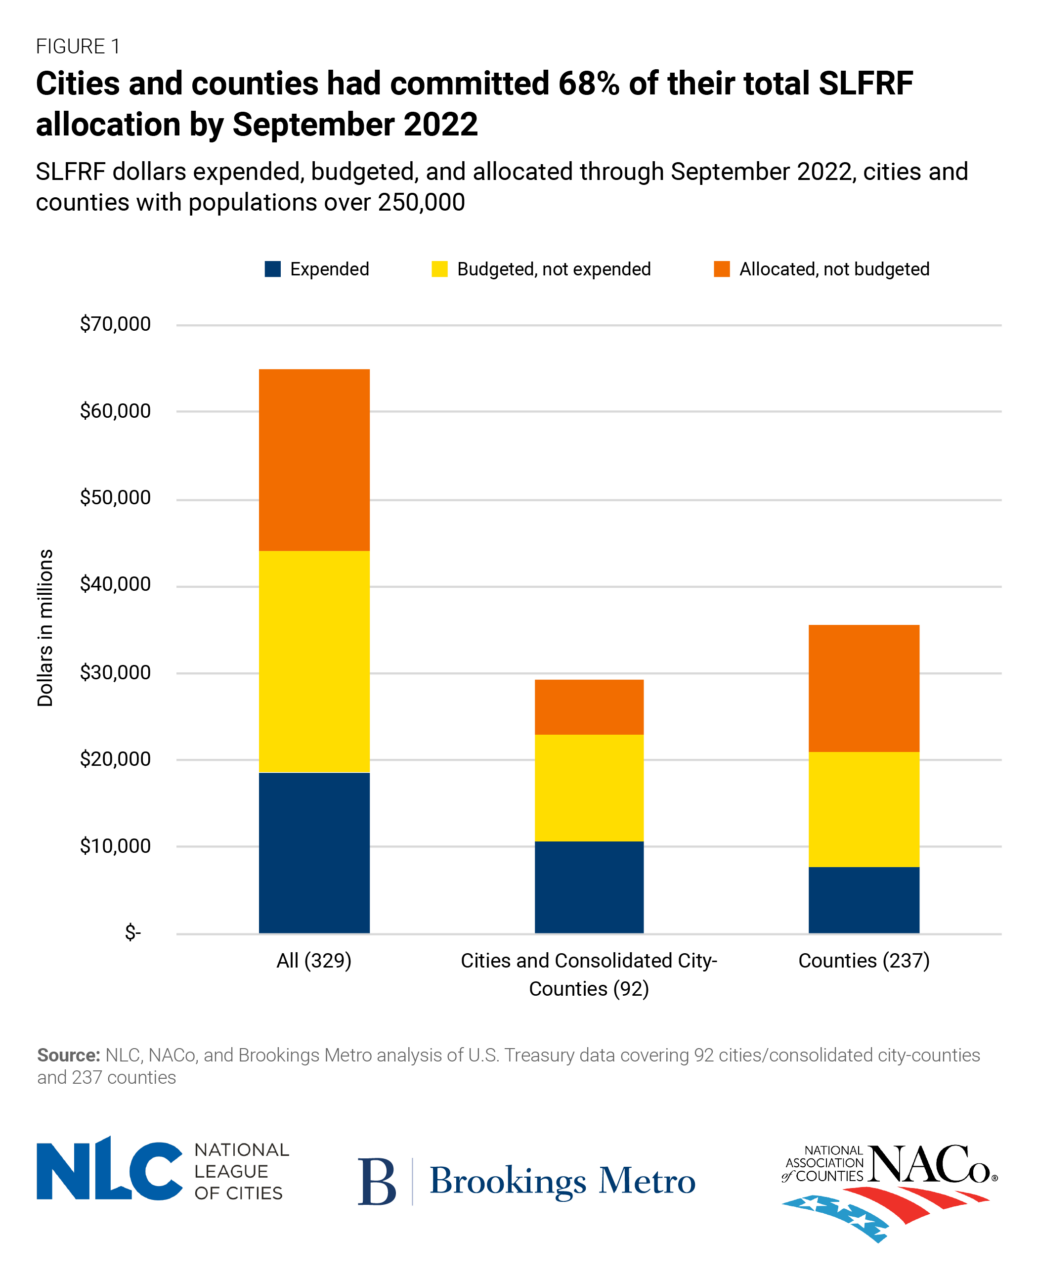
While the share of SLFRF allocations that had been committed increased in the latest reporting period, the breakdown of those commitments by spending group remained quite stable. Like previous analyses, large local government commitments were most concentrated in government operations (43%), which includes fiscal health recovery, employee wages, and investments in facilities and equipment. Following government operations, community aid (11%), public health (11%), infrastructure (10%), and housing (10%) were the most popular spending groups among all 329 cities and counties. New allocations made in the third quarter of 2022 did not differ significantly in their spending group priorities.
Cities and consolidated city-counties have committed nearly half (48%) of their recovery dollars to government operations, and allocated greater shares of their SLFRF commitments to housing and economic and workforce development (21%) than large counties (16%). Meanwhile, large counties focused 28% of their commitments on public health and community aid—nearly double the share in large cities/consolidated city-counties (15%).
Large cities and counties have spent 29% of their total SLFRF allocations
Large local government SLFRF expenditures are increasing faster than their allocations, which is to be expected as investments and programs move from planning to implementation. As of September 30, large cities and counties have spent nearly $19 billion of their total $65 billion allocation—an increase of about 23% since the end of June.
Overall, these local governments have now expended 29% of their total SLFRF allocations. Cities/consolidated city-counties have spent a substantially higher share of their allocations than counties (37% and 22%, respectively). Over half (55%) of these expenditures have gone toward government operations, followed by public health (11%), public safety (9%), and community aid (8%). Local governments are making expenditures in these spending groups faster than in infrastructure, workforce development, and housing areas.
SLFRF allocations vary across regions in several spending groups
Congress and the Biden administration designed the SLFRF program to provide considerable flexibility so that local governments could fund interventions that best meet their needs, subject to some high-level eligibility requirements. Since the economic, demographic, and fiscal starting points of local governments often vary based on wider regional dynamics, we assigned each local government in the analysis to a broader census region to examine how SLFRF commitments vary geographically.
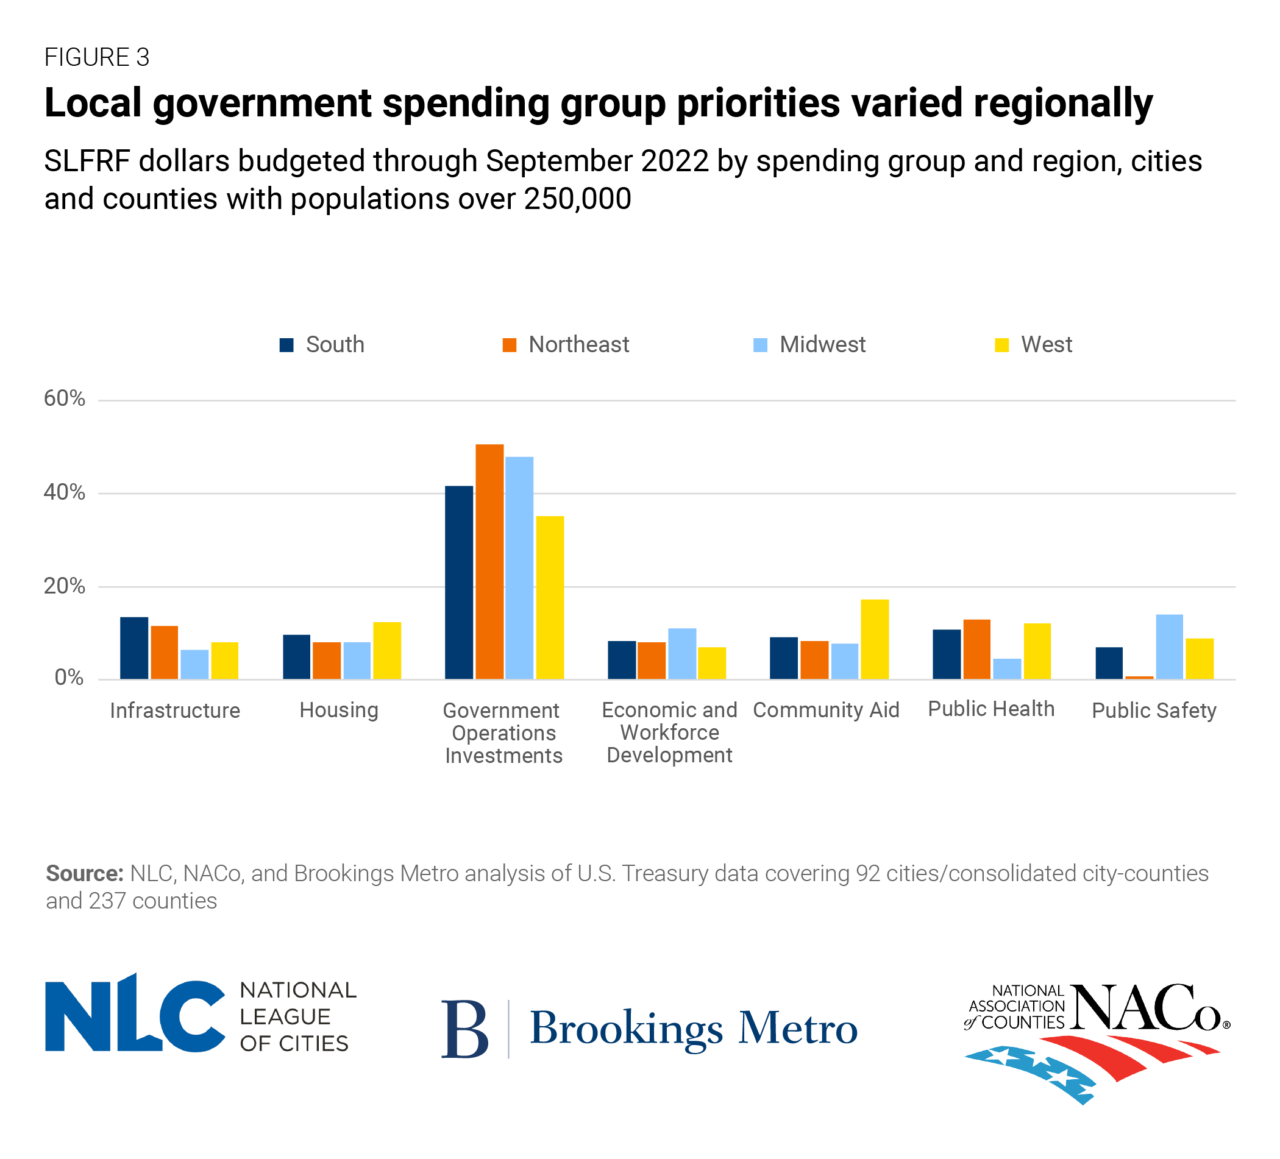
Across all regions, local governments’ largest commitments went to government operations, although less so in the West than in other parts of the country. From there, priorities began to diverge across spending groups. The spending group that received the second-largest allocation of SLFRF dollars among large cities and counties was community aid in the West (17%), public safety in the Midwest (14%), infrastructure in the South (13%), and public health in the Northeast (13%).
In certain sub-categories, priorities varied considerably. The housing affordability crisis is nationwide, but its impact on homelessness has been largest in West Coast regions such as the Bay Area, Denver, Las Vegas, Los Angeles, San Diego, Portland, Ore., and Seattle. Cities and counties in the West committed nearly 8% of their SLFRF allocations to combatting homelessness—more than twice the share as cities and counties in the other three regions.
Meanwhile, cities and counties in the South invested nearly 8% of their SLFRF dollars in water and sewer infrastructure, which is more than twice the share in the other three regions. Local officials may see these funds as a unique opportunity to maintain and expand those systems in response to the rapid influx of population to southern localities.
Finally, neighborhood revitalization was a much higher priority in Midwest cities and counties, many of which are using SLFRF dollars to address depopulation, blight, concentrated poverty, and racial segregation. Neighborhood revitalization accounted for over 2% of SLFRF commitments in the Midwest—more than eight times the share in the Northeast, South, and West.
The latest batch of Treasury data reveals that large local governments continue to accelerate their SLFRF commitments and expenditures. The program is supporting local governments across the country to stabilize their government operations and fiscal recovery. But it’s also helping large cities and counties address their distinct economic and social needs, as revealed by this new geographic analysis on recovery priorities.
Note: The total number of local governments studied in this analysis has changed from 330 (91 cities/consolidated counties and 239 counties with populations over 250,000) in the June 2022 data to 329 (92 cities/consolidated counties and 237 counties with populations over 250,000) in the September 2022 data.
The authors thank Ricardo Aguilar, Christine Baker-Smith, Alan Berube, and Teryn Zmuda for research advice and support.
Written in collaboration with Joseph Parilla, the Director of Applied Research at Brookings Metro, Glencora Haskins, a Senior Research Analyst and Applied Research Manager at Brookings Metro, and Sarah Edwards, a Research Analyst at the National Association of Counties.


