As of 2020, 80 percent of the United States population was defined as living in urban communities by the United States Census Bureau. Under this definition, the town of Blowing Rock, North Carolina is considered urban, despite a population of only 1,412. The remaining 20 percent is defined as the rural population based solely on not living in communities that meet the requirements for urban areas as determined by the U.S. Census.
While simplicity in methodology has its advantages, what is missing is room for other types of communities, like suburbs, exurbs (communities that lay outside the ring of suburbs surrounding large metropolitan areas and are usually the last communities before entering true rural areas) and college towns with unique challenges, that we commonly see among the NLC membership. There are many more variables that affect the experience of cities than just population housing density. NLC’s methodology proposes to use multiple variables across many data categories to offer a more nuanced representation of urban, rural and other communities.
Urban, Rural and Funding
NLC is creating a more useful and accurate metric to distinguish types of municipalities both for NLC’s outreach and other stakeholders interested in a more comprehensive categorization of jurisdictions. The methodology for defining urban and rural communities can directly impact cities because the budget for many federal programs includes formulas based on what qualifies as an urban or rural area. For instance, the Federal Communications Commission’s Rural Health Care Program uses the Census Bureau’s definition of a rural area to determine the eligibility of grant applicants.
In addition to the Census Bureau’s definition of urban and rural, some programs use additional criteria for their eligibility requirements such as:
- USDA Rural Business Development Grants
- USDA Rural Electrification Loans and Loan Guarantees
- USED Rural and Low-Income School Program
- FTA 5311 Formula Grants for Rural Areas
- FTA 5307 Urbanized Area Formula Grants
- NPS Paul Bruhn Historic Revitalization Grants Program
NLC Technique and Variables
NLC uses a machine-learning algorithm called K-Means Clustering designed to create a defined number of distinct groups based on multiple variables. Using this method, a clustering model can be generated based on our data with the number of groups we desire. For instance, a model with three groups could split the country’s cities into urban, suburban and rural categories, as is most commonly used today. However, if we generate a model with more groups, we can find more specific categories like exurbs and college towns.
NLC recommends using a six or eight group model based on our findings below. NLC has selected 29 variables across the areas of population, housing, workforce, transportation and infrastructure based on guidance from subject-matter experts across these areas (view a full list of data sources (PDF)). These variables control for population size to avoid having population differences overwhelmingly drive the categorization. The variables were controlled for population size by making them either a ratio of the overall population of the city or by converting them into a ratio of another related variable like dividing the number of residential properties in a city by the number of total properties. Some of the variables that were important in driving the categorization of the eight-group model were:
- Population
- Job density
- Percentage of the population as renters
- Number of Internet Providers
- Peak Public Transit Frequency per Capita (e.g., bus arrivals per hour for 10,000)
- Percentage of Properties by Type (e.g., residential vs agricultural)
- Population Change During the Day (%) (i.e., commuters traveling downtown for work)
One weakness of this method is that though we can make any number of groups based on our data, the algorithm does not tell us directly what the theme is for each of the groups. For this, we must infer a theme using our own intuition and experience like a group made up of only a few very large cities where the inferred theme might be the largest metropolitan areas. Likewise, a group with smaller populations where most land area is reserved for agriculture, the inferred theme might be rural communities.
This method is also sensitive to a few strong outlier points of a few cities which can create a niche category. The maps below are from a model run with eight groups, though two of the groups wound up being niche categories effectively leaving a six-group model instead. The cities in these categories had low populations which created outliers in the variables of daytime population increase (as a percentage) and total assisted housing units (as a percentage). Despite this, the other six categories provided interesting insights as can be seen below.
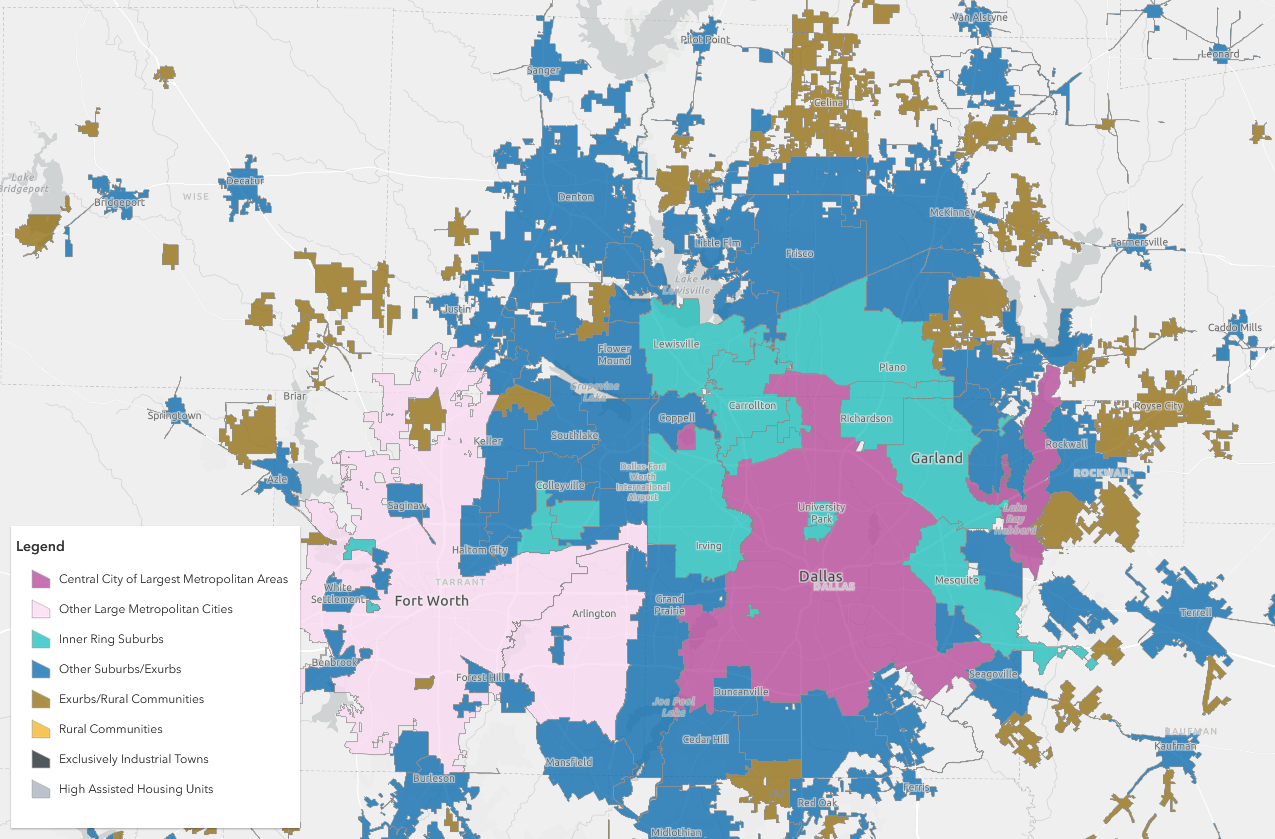
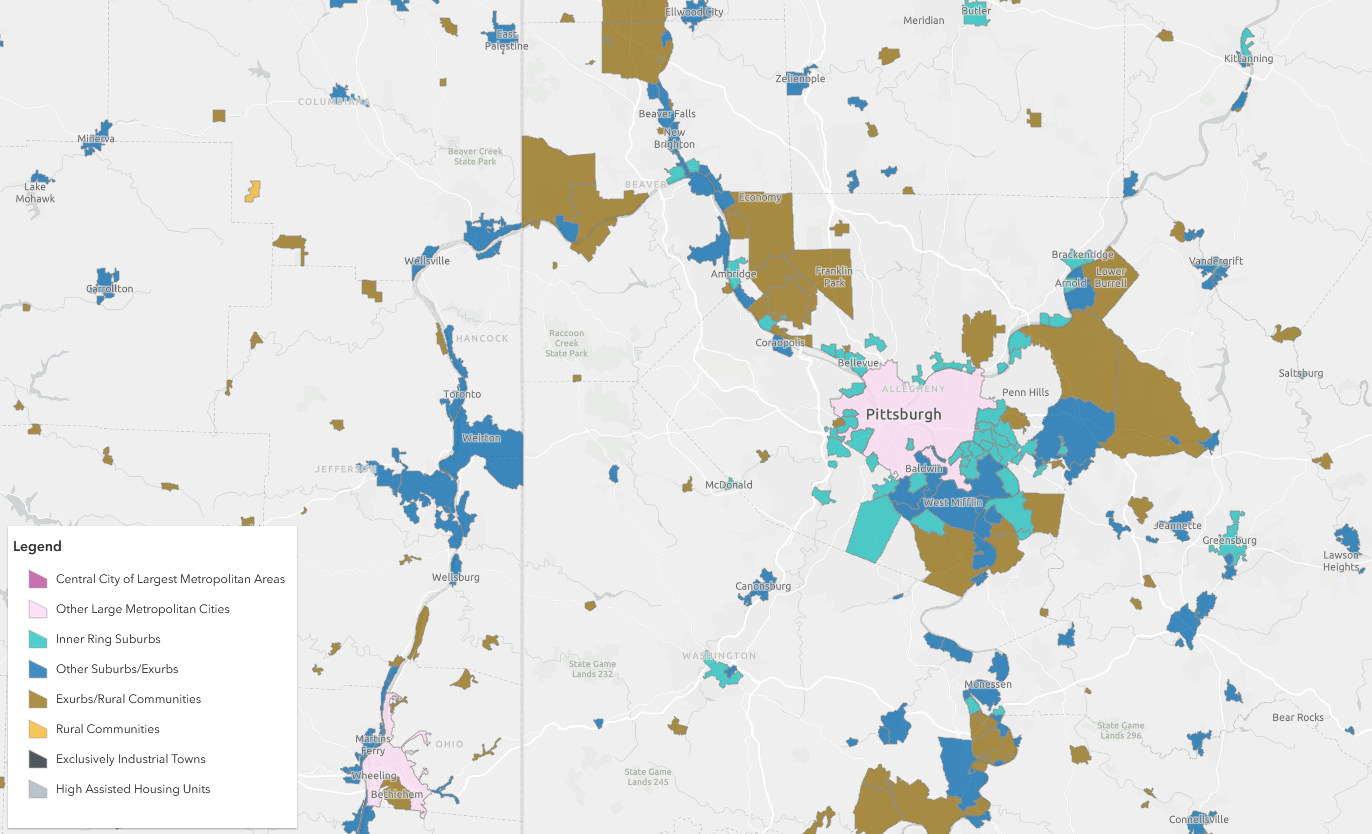
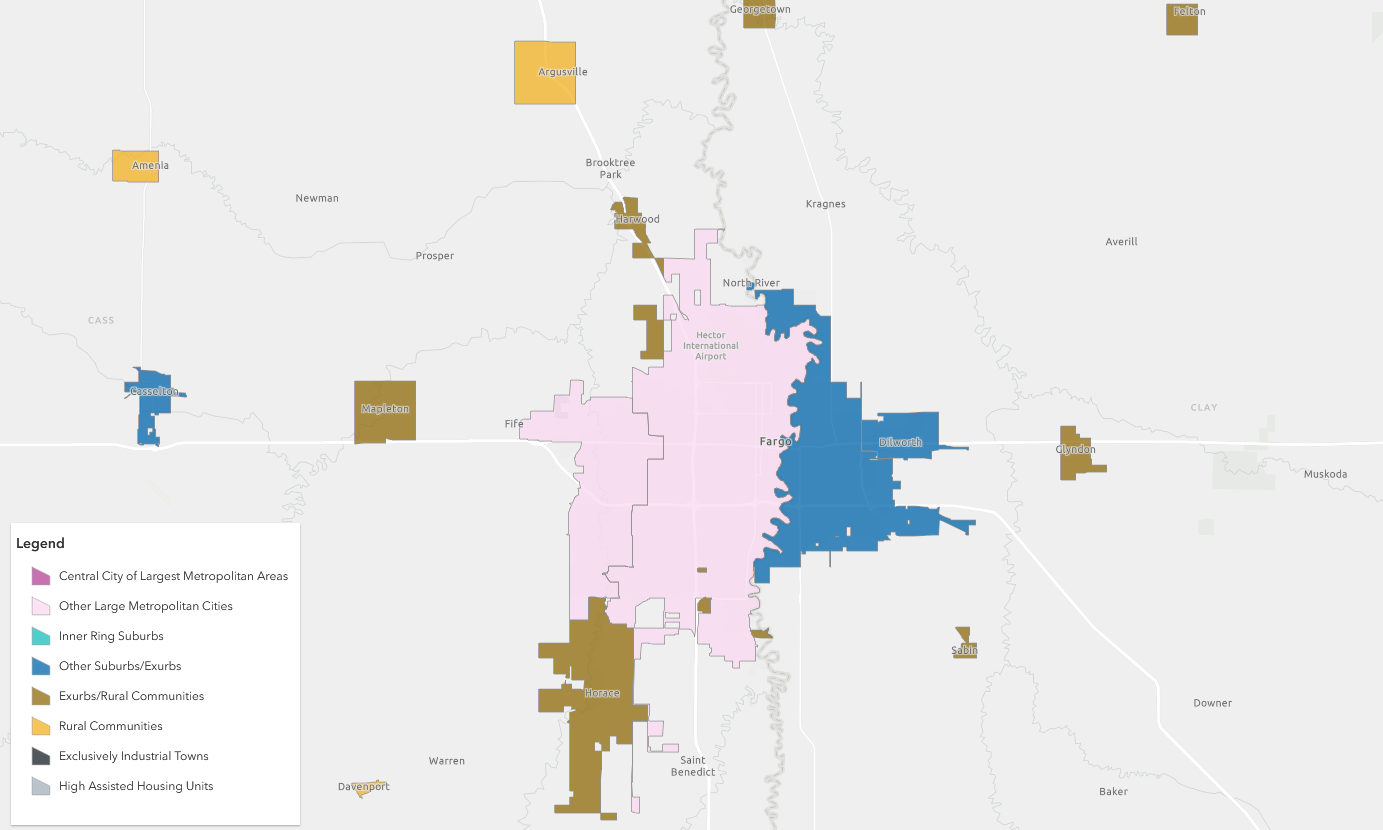
Below, explore a few more examples of how the NLC categorization would apply to jurisdictions:
Purple: Central City of Largest Metropolitan Areas
- New York City, NY
- Chicago, IL
- Los Angeles, CA
Pink: Other Large Metropolitan Cities
- Baltimore, MD
- Cleveland, OH
- Kansas City, MO
Teal: Inner Ring Suburbs
- Plano, TX
- Burbank, CA
- Salem, MA
Blue: Other Suburbs/Exurbs
- Laredo, TX
- Conway, AR
- Danbury, CT
Brown: Exurbs/Rural Communities
- Nome, AK
- Monroeville, AL
- Waitsburg, WA
Yellow: Rural Communities
- Fordsville, KY
- Junction, UT
- Ashley, MI
Black: Exclusively Industrial Towns
- Industry, CA
- Vernon, CA
Gray: High Assisted Housing Units
- Cooperton, OK
- Kupreanof, AK
As we use more data with this machine learning technique, some of the determinants we have used may become less important as others prove to be better at differentiating the groups. This would help create a model that is truly holistic and able to encompass the full range of municipal experiences in the United States.
Urban and Rural: Everything In-Between and Why It Matters
We need your help to improve this model! If you feel the groups we have identified so far don’t accurately define your city, please share your thoughts using the form below.
