Rail Safety in Communities Across the U.S.
More than 12,000 cities, towns and villages across the country are impacted by our nation’s 140,000-mile rail network crossing through neighborhoods and downtowns. Rail policy is primarily overseen by Congress, yet rail safety is a concern for all levels of government and residents in communities across the country.
Unfortunately, more than 4,000 trains have derailed since 2020 with nearly 70 percent of derailments happening in cities. Train derailments, like the catastrophic Norfolk Southern derailment in East Palestine, Ohio, are not isolated incidents. Recently, derailments have happened in places like: Matteson, IL; Niagara Falls, NY, Bethlehem, PA; Adrian, OH; Grants, NM and Holbrook, AZ; Springfield, OH; and Fargo, ND; Bike Lake, MN to name only a few. Despite railroads running less but longer trains, derailments have not substantially decreased so trains are more likely to derail carrying hazardous materials that are highly explosive increasing the risk to the communities they pass through.
In response to the frequency of rail safety issues and the derailment in East Palestine, OH, both the Senate and House are currently considering legislation to make rail transportation safer. The bipartisan Railway Safety Act of 2023 (S.576/ H.R.1674) and the new Railway Safety Enhancement Act (H.R.8996) have had strong bipartisan support as well as the ongoing support of both President Biden and former President Trump. America’s cities, small towns, governors, counties, first responders and railroad customers have spent the last year sharing with Congress how helpful the bipartisan legislation would be for safety. Now, the Federal Railroad Administration testified to Congress that they see stagnation in railroads’ safety performance. Due to recent court cases like Horton v. Kansas City Southern Railway Company and Ohio vs. CSX, Congress is the only entity with unquestioned authority to improve rail safety in the U.S. Rail safety is a priority for the National League of Cities, and we encourage you to join us in working with Congress to pass rail safety legislation this Congress.
Rail Safety Facts to Know
Frequency

Every day in the U.S., an average of three trains derail with as many as half potentially carrying hazardous substances
Nearly 1 in every 5 cities have been affected by rail incidents since 2020
Two-thirds of all rail accidents (66%) happen within cities
On average, cities experienced 6 reports of rail incidents for every 10,000 people
Type

While rail incidents are in every region of the country fairly equally, blocked crossings are most common in the Mid-West where the average number per 10,000 people is 41.8 as compared to next highest of 24.6 in the South

More than half of all accidents are derailments (51%)
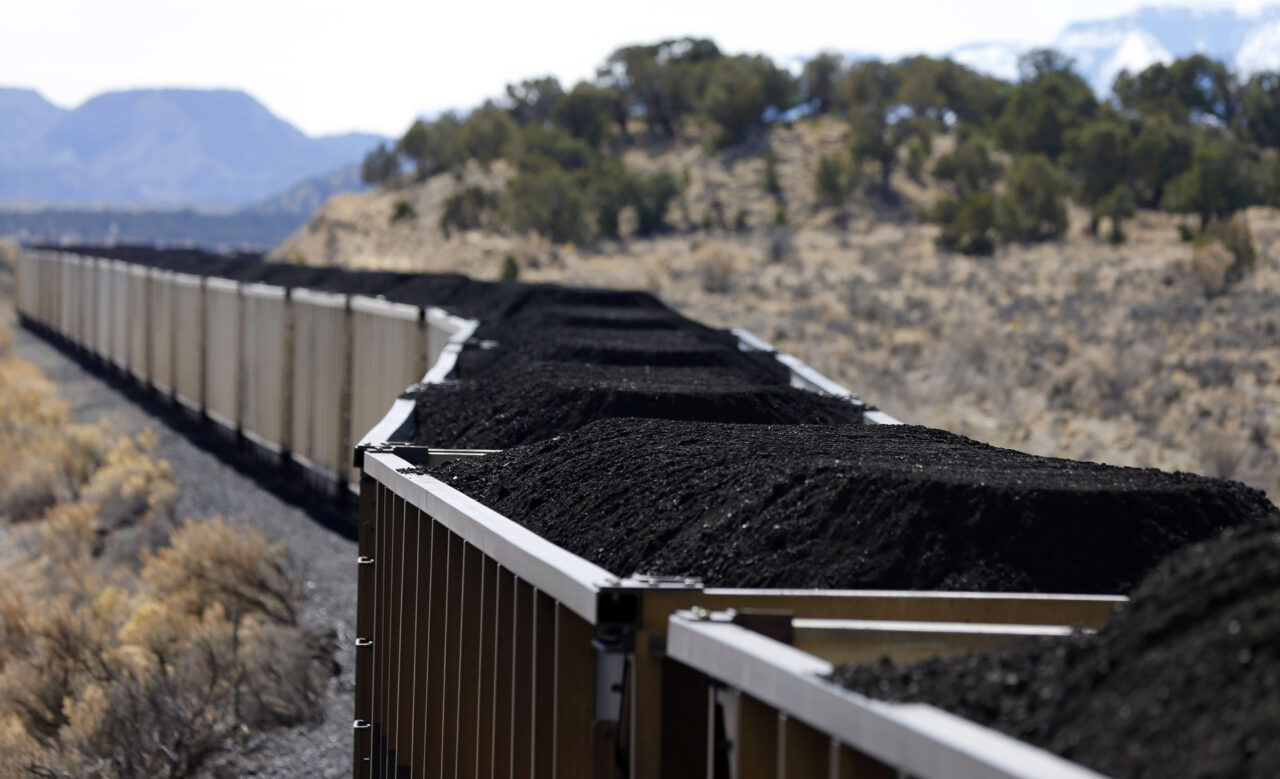
Derailments are the most common type of accident to happen in a city (68%)
Geography

Small cities are disproportionately affected by rail accidents: Cities with fewer than 1,000 residents have an average of 12.9 accidents as compared to 3.1 for cities between 1,000 and 10,000 and less than 1 for cities over 50,000.
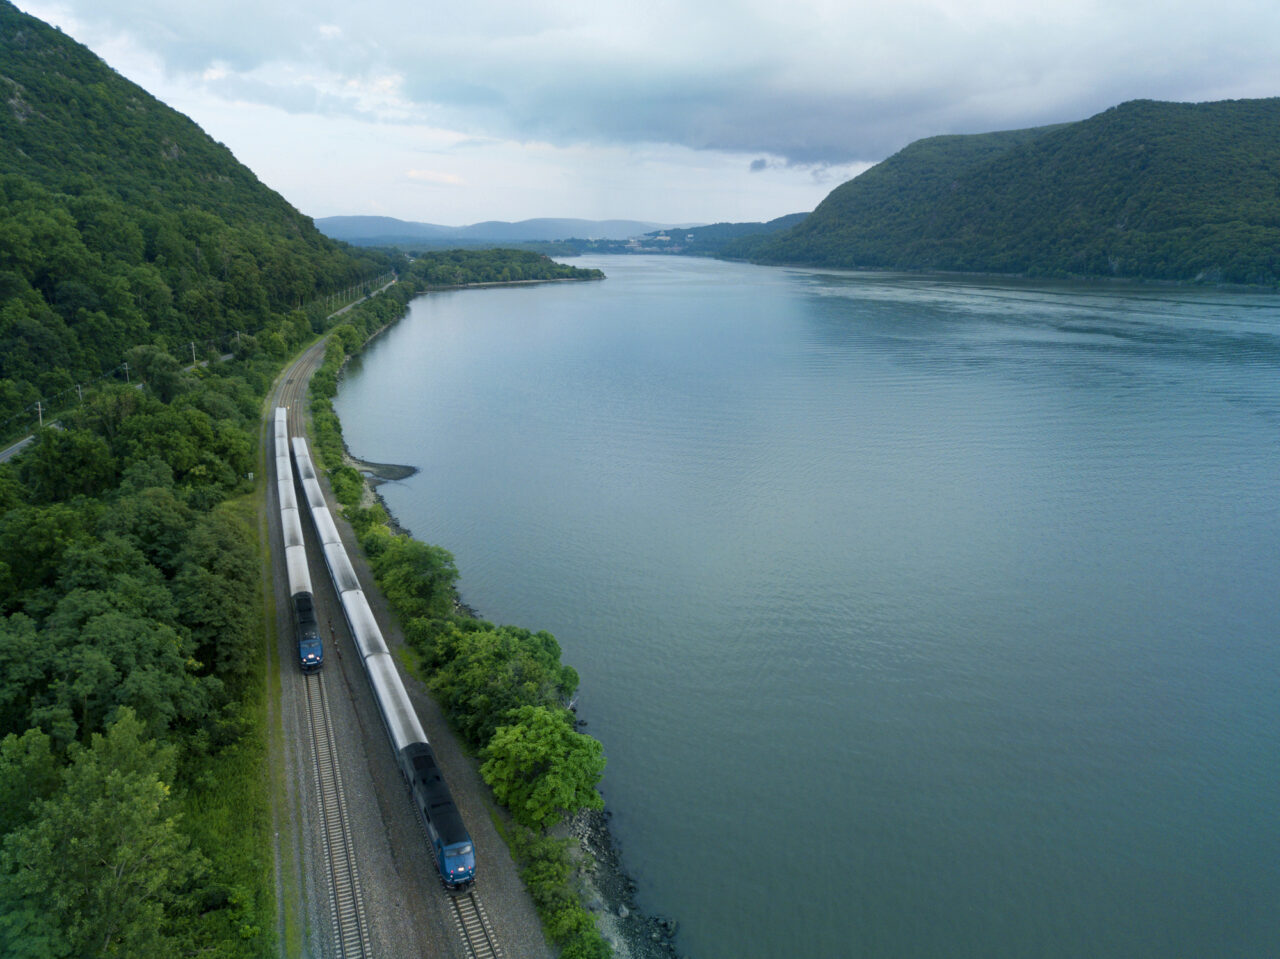
More than half of cities (58%) are touched by the national rail network
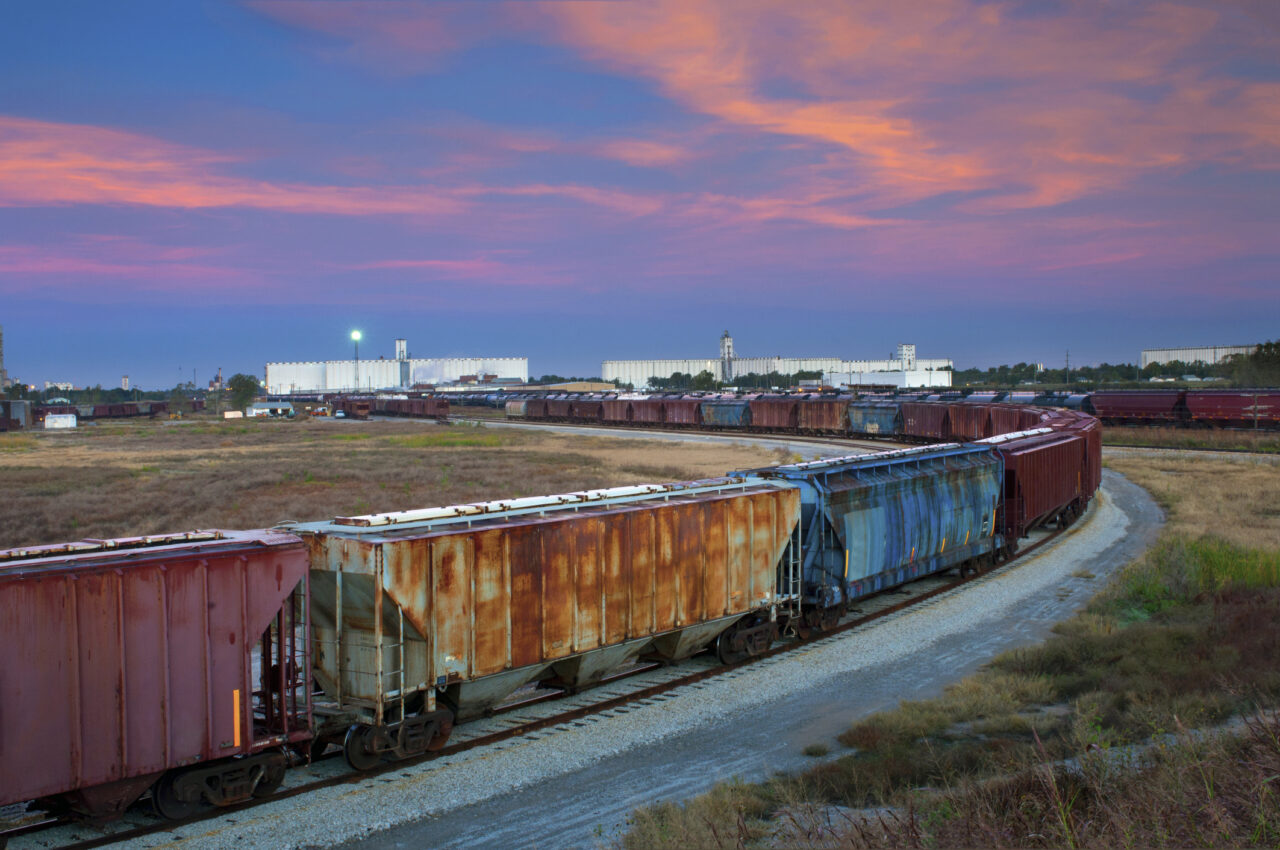
While train accidents happen in every region, there are more overall in the West than any other region.
How to Use the Map
National View:
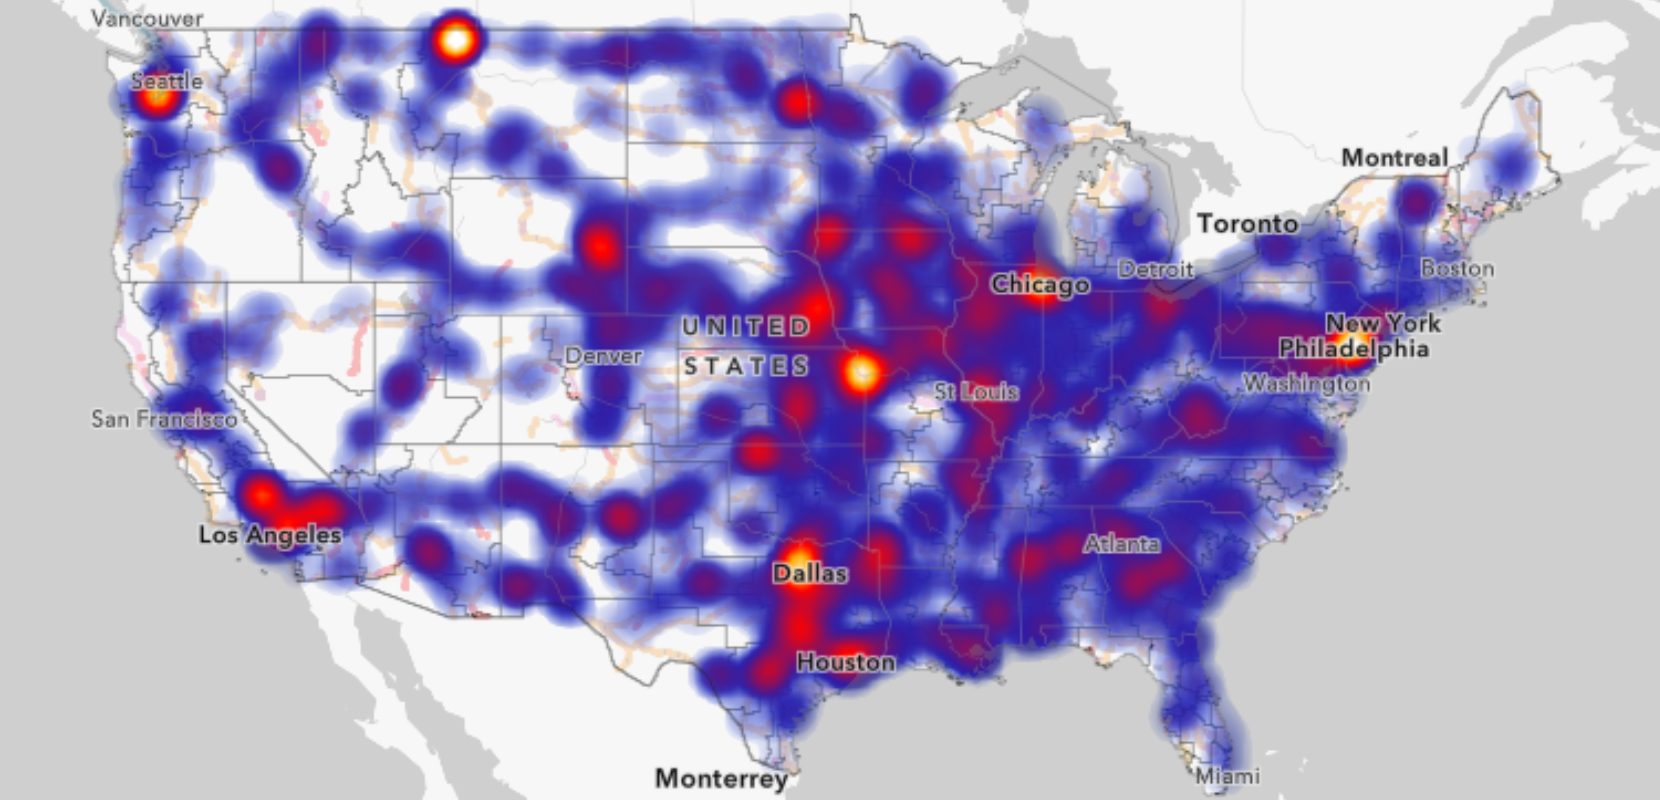
- When zoomed out, the heat map shows the density and intensity of derailments in terms of the total cost of reported damages and the number of people injured or killed.
- Find a specific city, town or village by using the search icon in the upper lefthand corner to zoom in on locations or the +/- Zoom Controls
- To search by Congressional district, type the state abbreviation in the search bar and select the district number from the drop-down menu.
* Please see the bottom of the page for source notes and terms of use. Note: derailment reports not submitted to the Federal Rail Administration by April 20, 2023, will not show up in the map. This includes the incident in East Palestine, OH, which occurred on February 3, 2023.
NLC’s interactive train derailments map allows you to easily see the frequency of derailments in your city and Congressional district area.
When zoomed out, the heat map shows the density and intensity of derailments in terms of the total cost of reported damages and the number of people injured or killed.
- Find a specific city, town or village by using the search icon in the upper lefthand corner to zoom in on locations or the +/- Zoom Controls
- To search by Congressional district, type the state abbreviation in the search bar and select the district number from the drop-down menu.
* Please see the bottom of the page for source notes and terms of use.
Local Leaders Call for Federal Action on Rail Safety
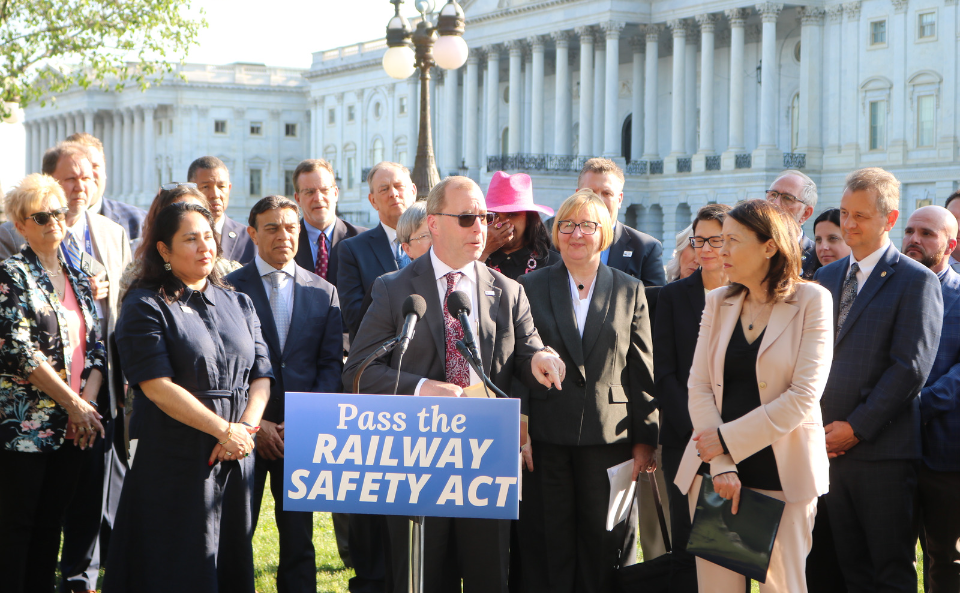
Inside Rail Safety Legislation
The bipartisan Railway Safety Act of 2023 (S.576/ H.R.1674) and the Railway Safety Enhancement Act (H.R.8996) include many rail safety provisions that are needed, but these bills tackle three essential areas for communities. Click on the arrows to learn more:
First Responder Communication Improvements and Training
When firefighters were running towards the East Palestine emergency, several communication and safety gaps were identified, and these were addressed with common sense changes in the Railway Safety Act and the Railway Enhancements Act in addition to training and notification requirements.
Blocked Rail Crossing Relief:
The Railway Safety Enhancements Act would support an additional $1 billion in funding for communities through the Railroad Crossing Elimination program which allows communities to build overpasses and underpasses at railroad crossings to ensure both rail and traffic can smoothly operate. Importantly, these bills would allow blocked rail and road crossings to be adequately studied and addressed so that congestion and first responder response costs can be reduced.
Stopping Derailments to Save Communities, Railroads and Shippers Wasted Expense:
Keeping trains on the tracks saves railroads and their customers unnecessary costs. That includes saving farmers, manufacturers, chemical and fuel producers who rely on rail to ensure their products arrive on time and in one piece. It also saves communities from having to cover the cost of first responders being called to respond to hundreds of derailments annually.
Recent action from NLC urging Congress to pass rail safety legislation:
- First Responders and Communities Expect a Rail Safety Bill from Congress After East Palestine Report
Take Action
Action is needed by Congress to pass these bill into law before another derailment strikes. Join NLC and make your voice heard in one of the following ways:
Send a Letter to Congress
Join hundreds of other municipalities and send your Members of Congress a letter on rail safety.

Inform Your Community
Become a Hometown Champion with NLC and help highlight rail safety in your community.
Derailment Map Source Notes & Terms of Use
The data for derailments is derived from the Federal Rail Administration Rail Equipment Accident/Incident Report (Form 54). The dataset was downloaded on April 20, 2023, from the US Department of Transportation’s Open Data Catalog (and thus does not include the East Palestine, OH incident). For this visual, non-derailment incidents and derailments in train yards were excluded. Additionally, incidents reported by commuter and passenger rails (except for Amtrak) were also excluded. Incidents with total damage costs up to $1M were grouped together in the smallest bubble size. Congressional district boundaries are based on the current 118th Congress.
Analysis of data is based on the number of reports to the FRA and may exclude unreported incidents. Regions are based on Census regions using provided geocoding from the FRA data. All values are based on the total count of incidents, by type, between 2020 and 2024.
National view: This map shows the density and intensity, scaled by the total damage cost, of reported derailment incidents at its default “zoomed out” view.
Detail view: Zooming in to view a state, region, or locality, the map displays bubbles for each individual incident. The size of each bubble is scaled by the total damage cost as a proxy for overall impact and the color denotes whether or not Injuries or deaths occurred as a result of the incident. Clicking on an individual incident bubble opens a card with summary information and the full FRA Form 54 data. Information about each rail line is also available by clicking on the map. The search icon on the upper lefthand corner can be used to zoom in on locations along with the +/- Zoom controls. The Home button returns the map to the national view.
Terms of Use
This work is licensed under a Creative Commons by Attribution (CC BY 4.0) license. Sources: Esri; U.S. Census Bureau; Clerk of the U.S. House of Representatives; Federal Railroad Administration (FRA) and the Bureau of Transportation Statistics (BTS); HERE, Garmin, FAO, NOAA, USGS, © OpenStreetMap contributors, and the ESRI GIS User Community
For citation of the map please use:
Ahmed, Zuhayr. (2023) “Interactive Rail Safety Map: Derailments Across the U.S.” National League of Cities. Washington, D.C.
For citation of the statistics please use:
Grabowski, Erica. (2024) “Interactive Rail Safety Statistics: Derailments Across the U.S.” National League of Cities. Washington, D.C.
